Analysis view
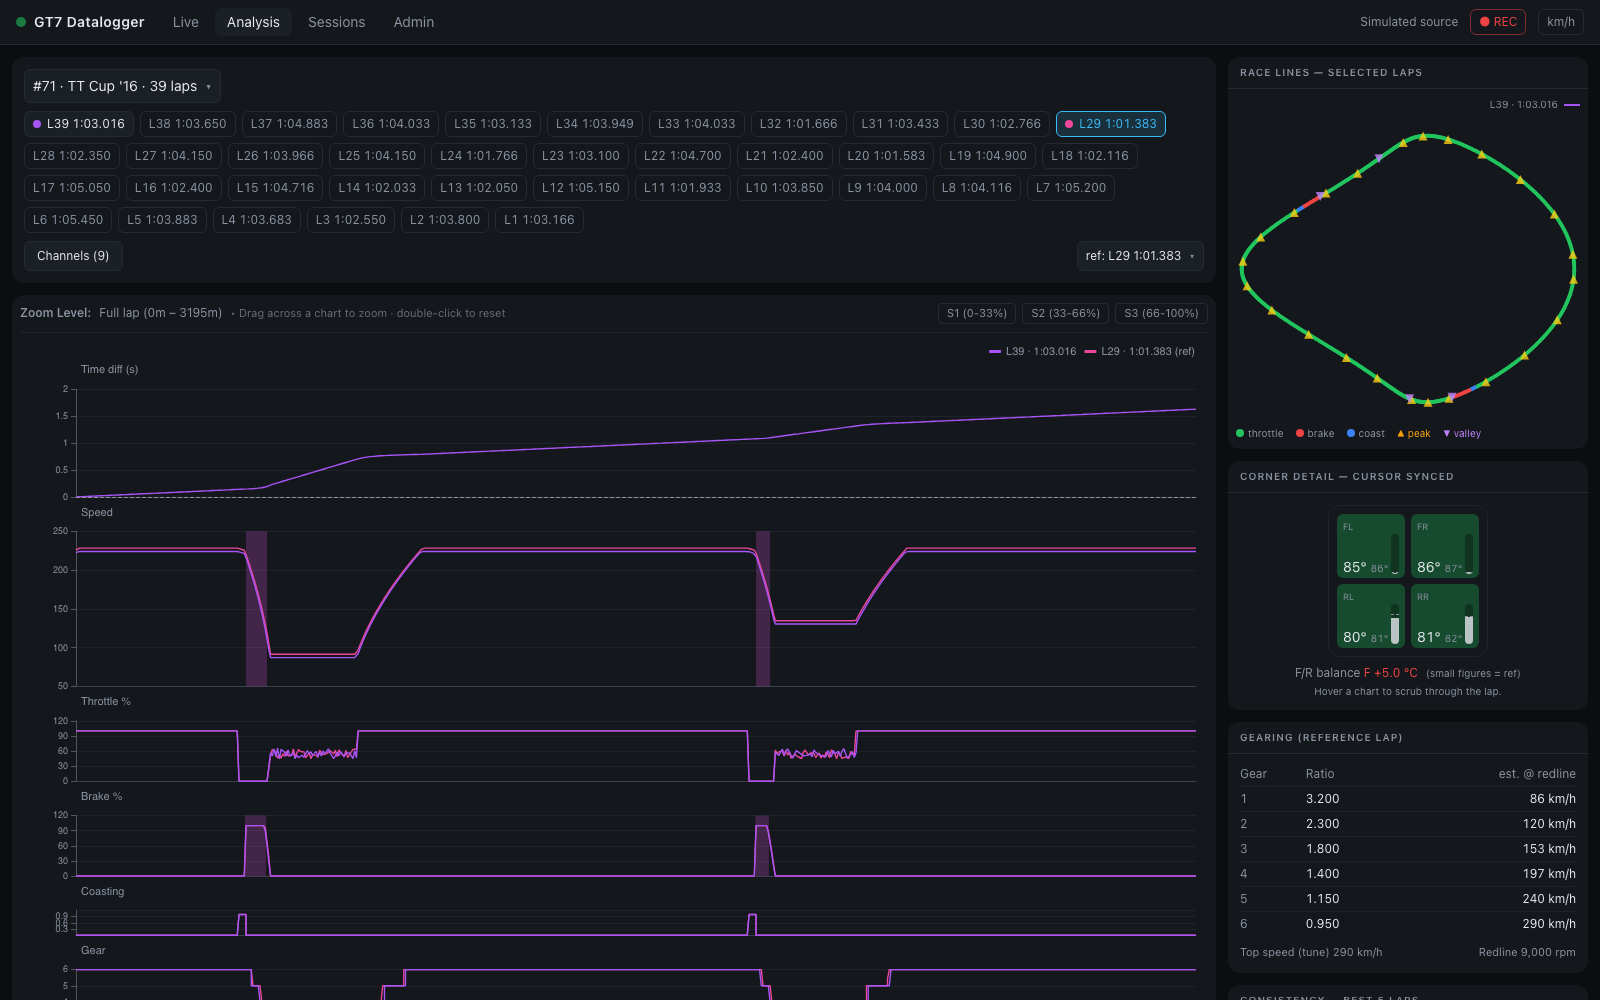
#/analysis — overlay any number of laps against a reference lap and find where the
time goes. The x-axis everywhere is distance into the lap, so laps of different
speeds line up corner-for-corner (see Lap comparison math).
Selecting laps
- Pick a session from the dropdown (
#id · car · n laps). The newest session with laps is selected by default. - Click lap chips to toggle them into the comparison.
- Double-click a chip (or use the
ref:dropdown) to make it the reference lap — the lap everything else is measured against.
Until you pick manually, the view auto-selects latest vs best and keeps following as new laps arrive live — useful on a second screen while driving. Any manual change pins your selection.
Deep links
The full selection is encoded in the URL —
#/analysis?session=3&laps=12,15&ref=15&ch=speed,brake — so a bookmark or shared
link reproduces the exact view. The Sessions and Live views use these links for
their compare / analyze shortcuts.
Stacked charts
The first panel is always Time diff (s) — each lap's gap to the reference over distance (positive = slower; where the curve climbs is where you lose time). Below it, one panel per selected channel.
- Synced cursors — hover any panel and a crosshair appears at the same distance in every panel, on the race line map, and in the Corner Detail widget. The tooltip shows one column per lap, unit-formatted.
- Zoom — drag across any chart to zoom a section; every panel, the map, and the deviation chart crop to it. Double-click to reset, or use the S1 / S2 / S3 buttons to jump to thirds of the lap. (Mouse-wheel zoom is off on purpose so page scrolling stays normal.)
- Event shading — detected chassis events shade the panel that explains them: lockups on Brake, wheelspin on Throttle, bottoming/kerbs on suspension panels; TCS activity shades Throttle, ASM shades Speed. Bands are tinted in the lap's color.
Channel picker
The Channels (n) button opens a grouped picker with ~20 channels:
| Group | Channels |
|---|---|
| Driving | Speed, Throttle, Brake, Coasting, Gear, Yaw rate, Steering, Throttle/Brake applied, TCS cut, ABS release |
| Engine | RPM, Boost |
| Tires & wheels | Tire spd/car spd, slip front/rear avg, slip per wheel, tire temp front/rear avg, tire temp F−R balance |
| Chassis | Ride height, susp travel front/rear avg, lateral / longitudinal / vertical g |
Your selection persists in the browser and is added to the URL when it differs from the default nine-panel stack. Laps recorded before a channel existed simply skip that line.
Aid intervention, measured rather than inferred
Throttle applied / Brake applied are the pedal after the aids acted on it.
Plotted against the raw pedal the two lines separate exactly where TCS or ABS
intervened; TCS cut and ABS release are that separation on its own. These
need the ~ packet format or wider — see
Configuration.
Race line map
A top-down plot of the reference lap's driven line, colored by input zone — green = throttle, red = braking, blue = coasting — with ▲ speed peaks and ▼ valleys marked. Other selected laps overlay as colored lines. It follows the chart cursor, placing one dot per lap at the hovered distance so you can see the spatial gap between lines, and it auto-crops when you zoom a section.
A metre across is a metre down, so a corner's shape on screen is its shape on the track. The axis ranges follow the plotting area's pixel aspect to keep it that way in any window; letting each axis fill the box independently stretches the map by whatever the circuit's aspect ratio happens to be — 8 % at Lago Maggiore Centre, nearly 3× at Deep Forest.
Corners
The corner strip under the map is the fast way around a lap: click a number — or the
numbered circle on the map itself — and everything zooms to that corner, charts included,
with the braking zone into it and the exit out of it for context. ‹ › step through
them and wrap; lap goes back to the whole circuit. The selected corner is named
beside the strip (T5 · left).
The corners come from the reference lap's curvature, or from the circuit's authored corners when it has them — in which case the numbering is the same in every session, not just within this one.
Full screen
⤢ (top right of the map) opens the same map as large as the window will allow, which is the difference between a squiggle and a track on anything longer than a kart circuit. The maximized view adds scroll to zoom and drag to pan — off in the rail, where a wheel that sometimes scrolls the page and sometimes zooms a chart is worse than one that always scrolls — plus the selected corner's minimum speed and total angle. Escape or Close returns.
Under the line: the surveyed road. If the session's circuit has been named and
surveyed, the map draws the track itself beneath every lap — road surface,
both borders, hand-marked walls in dark red, and the start/finish line. A racing line
only means something against the road it was driven on: whether the apex was clipped,
how much kerb was used, whether there was tarmac left on the exit. Circuits with no
bundle simply draw as before. The geometry is compiled server-side
(/api/track-outline) — a bundle holds up to 50,000 border records and the browser
never sees them.
The road is drawn only where it was actually surveyed. Stretches the survey never covered appear as dashed amber "unsurveyed gap" markers rather than invented road — the map's own go touch this prompt: drive that stretch on a survey run and the hole fills in.
Traction circle (g-g)
Every moment of the lap plotted as lateral g against longitudinal g, coloured by input zone: braking at the bottom, power at the top, corners out to the sides, and the combined phases — trail-braking in, picking up throttle while still turning — filling the diagonals. How much of the ring gets used is the reading; an empty middle-left and middle-right is a car that never brakes and turns at the same time. Other selected laps appear as faint dots in their own colours, and the four numbers underneath are the peak g reached in each direction.
The panel appears whenever the recording has the accelerometer (packet B or wider).
GT7 documents no unit for these channels
So the app checks them rather than trusting them: the server fits each axis against
physics the same lap recorded — lateral against v × ω from the driven path,
longitudinal against dv/dt — which recovers both the unit and the sign. The
footnote under the diagram reports the fit. When a lap gave too little steady
cornering or braking to check, it says scale unverified and assumes m/s²: the
shapes still compare between laps, the absolute numbers may be off by a constant.
Corner Detail widget
A top-down car with four corner cells that replays the load-transfer story as you scrub the charts:
- cell color = that wheel's tire temp (blue < 55 °C, green 55–95 °C, red ≥ 95 °C)
- bars = suspension compression, normalized to that lap's travel range
- LOCK / SPIN badges using the live thresholds (brake ≥ 20 % & slip < 0.9; throttle ≥ 40 % & slip > 1.1)
- F/R temp balance readout at the bottom
One lap is in focus at a time; the reference lap is always the ghost — small secondary temps and dashed suspension levels — and a cell gets a red/blue ring when the focus lap runs more than 3 °C hotter/cooler than the reference at that point. With 3+ compared laps, focus chips let you switch the focus lap.
Side panels
- Gearing (reference lap) — per-gear ratios with estimated speed at redline, tune top speed, and redline RPM.
- Consistency — best 5 laps — median speed plus a deviation band across the session's best laps; a wide band marks corners you drive differently every lap.
- Fuel strategy — the relative fuel-map table: for each setting −5…+5 vs the reference lap's, projected fuel/lap, laps remaining, time remaining, and lap-time cost.
- Tuning info (reference lap) — max speed, min ride height, input percentages, tire spin, fuel used, car category, aid usage (TCS/ASM %), engine health (max water/oil temp, min oil pressure), and the detected-event summary. When the circuit is named and the car's class is known, it also shows the class benchmark — the fastest full lap ever recorded at this circuit in the same category, the gap to the reference lap, and a link to open it. Scoped by class on purpose: a Gr.3 time and an N100 time around the same corners are not the same achievement.