GT7 Datalogger
A telemetry datalogger and analysis dashboard for Gran Turismo 7. It captures the PlayStation's live telemetry stream, records every lap, and serves a modern dark-themed web dashboard for live driving, lap comparison, race strategy, and session management.
What it does
GT7 streams encrypted telemetry over UDP at 60 Hz while you drive. GT7 Datalogger:
- Captures that stream — Salsa20 decryption, heartbeat keep-alive, auto-discovery, automatic reconnect.
- Records every lap — ~28 channels at 60 Hz including per-wheel slip, per-corner tire temps, and suspension travel, plus per-lap aggregates and detected chassis events (lockups, wheelspin, bottoming, kerb strikes).
- Serves a web dashboard — live race readouts, multi-lap analysis with synced cursors and a race line map, session history, and a fully customizable OBS/phone overlay builder.
Everything runs in a single container (or natively on hardware as small as a Raspberry Pi Zero) and is viewed from any browser on your network.
Quick start
GT7_PS_IP=<your playstation ip> docker compose up --build
Open http://localhost:8000 and start driving. No PlayStation handy? Run
GT7_SOURCE=sim docker compose up --build for a fully simulated demo.
→ Full quick-start guide
The four views
-
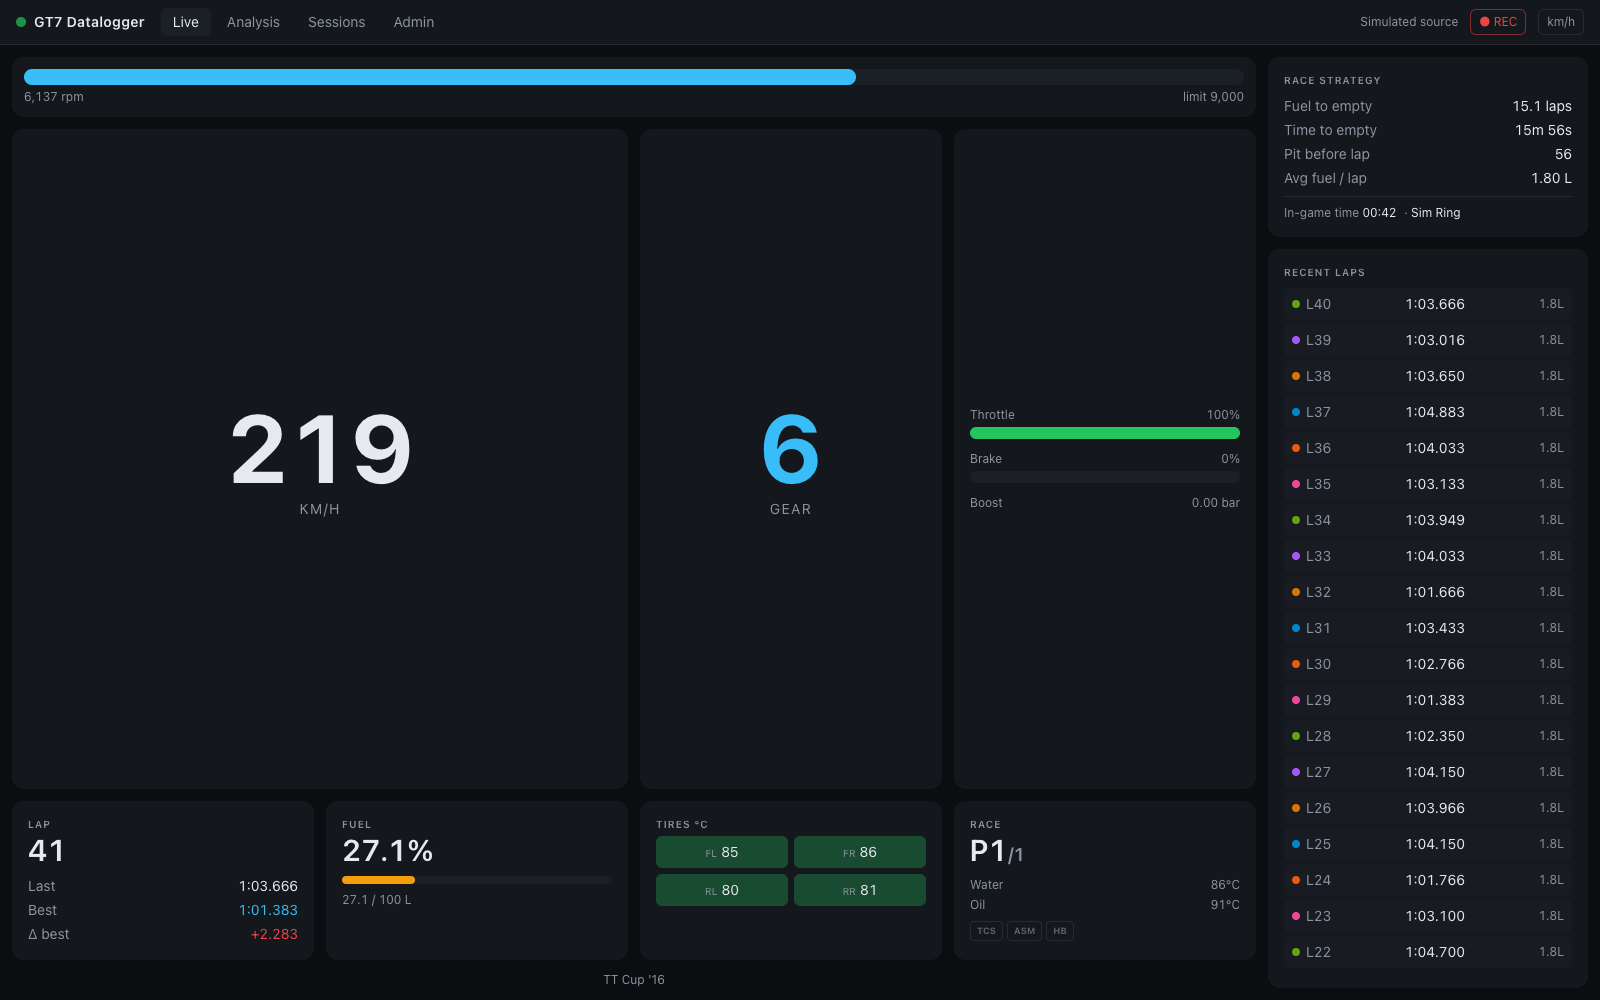
Live view — big race readouts: speed, gear, RPM with limiter flash, inputs, tires, fuel, delta, driver-aid pills, live strategy, and a clickable feed of completed laps.
-
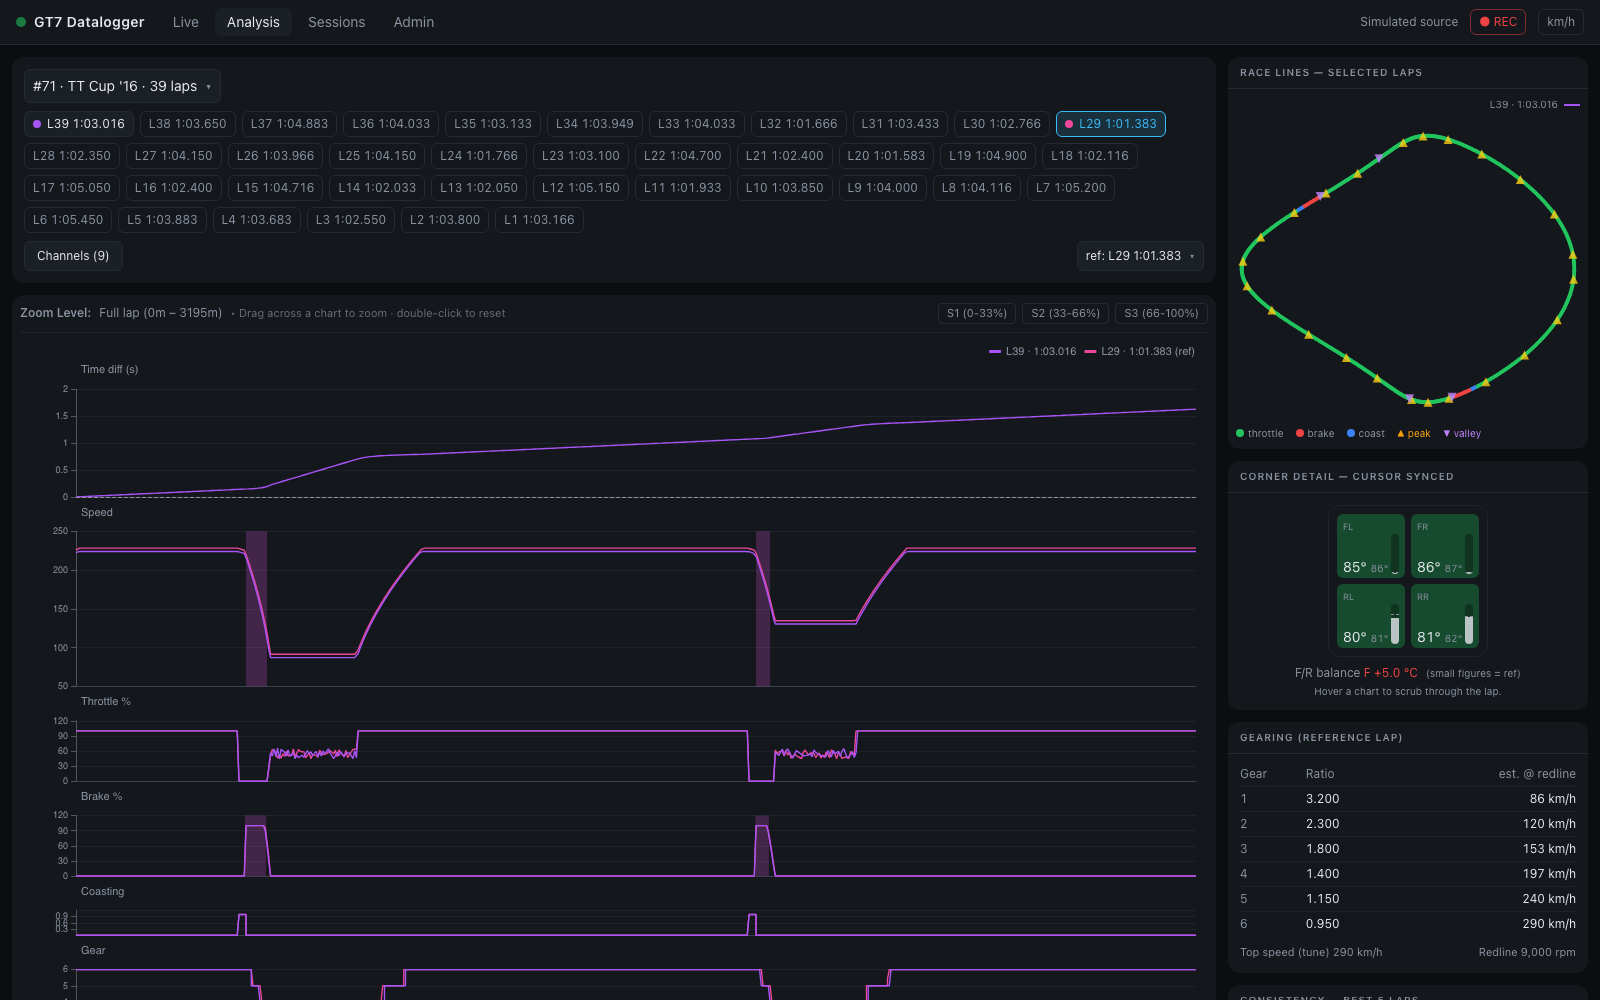
Analysis view — overlay multiple laps against a reference: ~20 telemetry channels, time-diff over distance, synced cursors, race line map, corner detail widget, detected events, and a gearing panel.
-
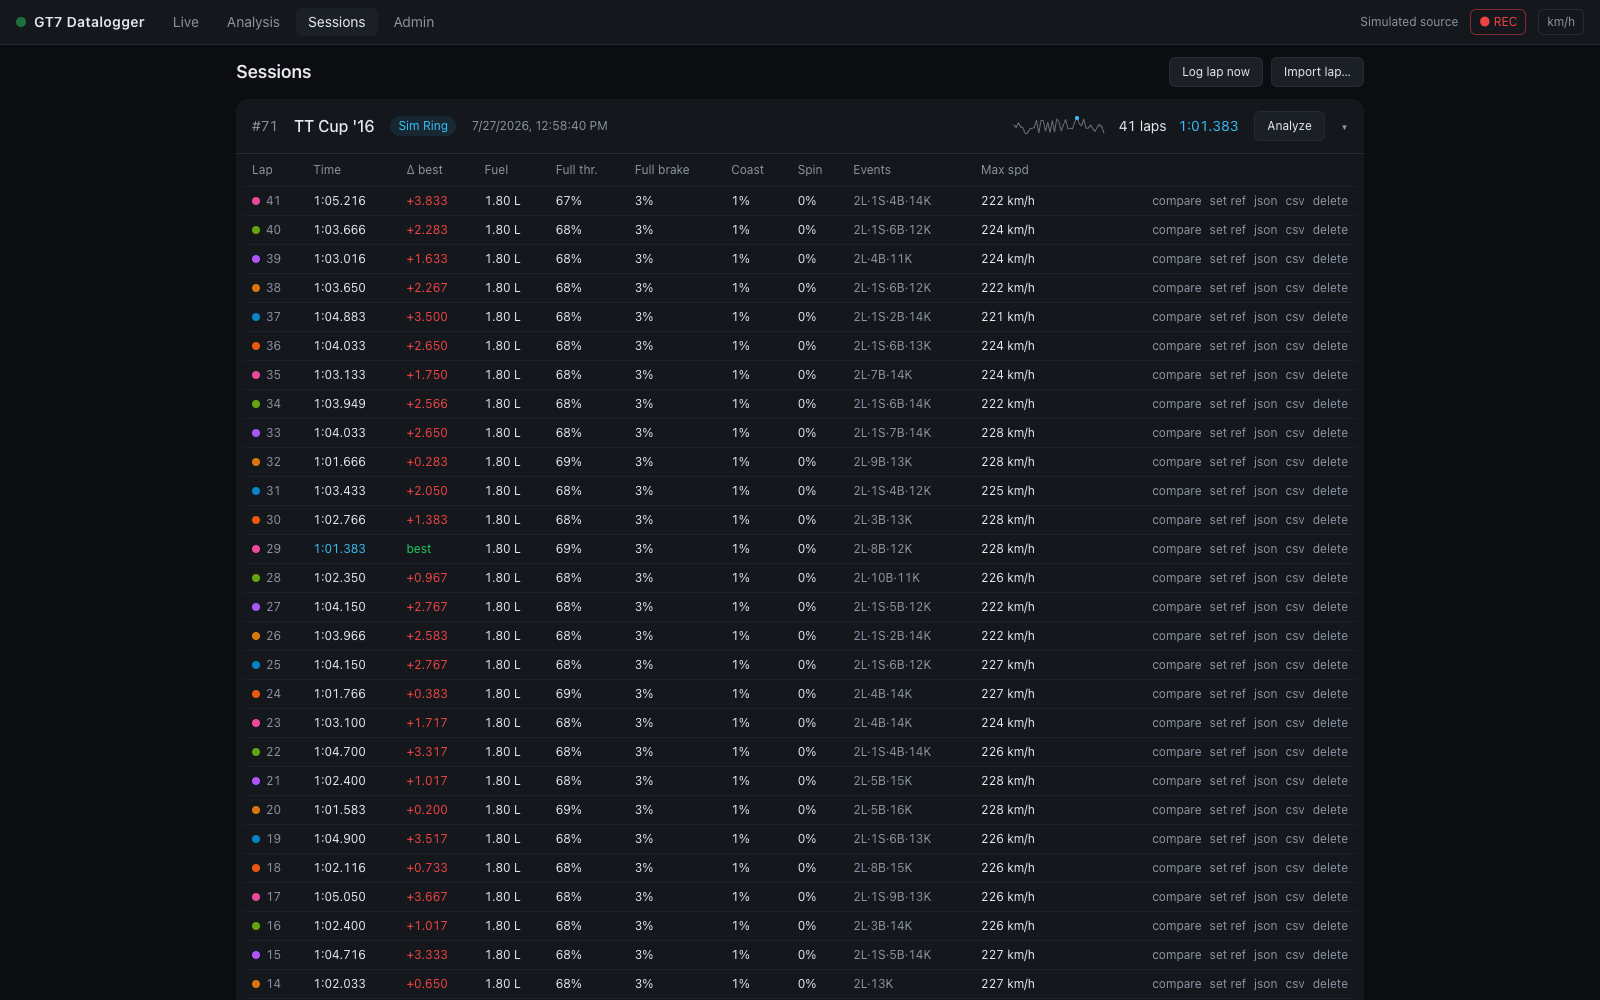
Sessions view — browse history with lap-time sparklines and per-lap metrics; export laps as JSON or CSV/MoTeC, import shared laps, manage recording.
-
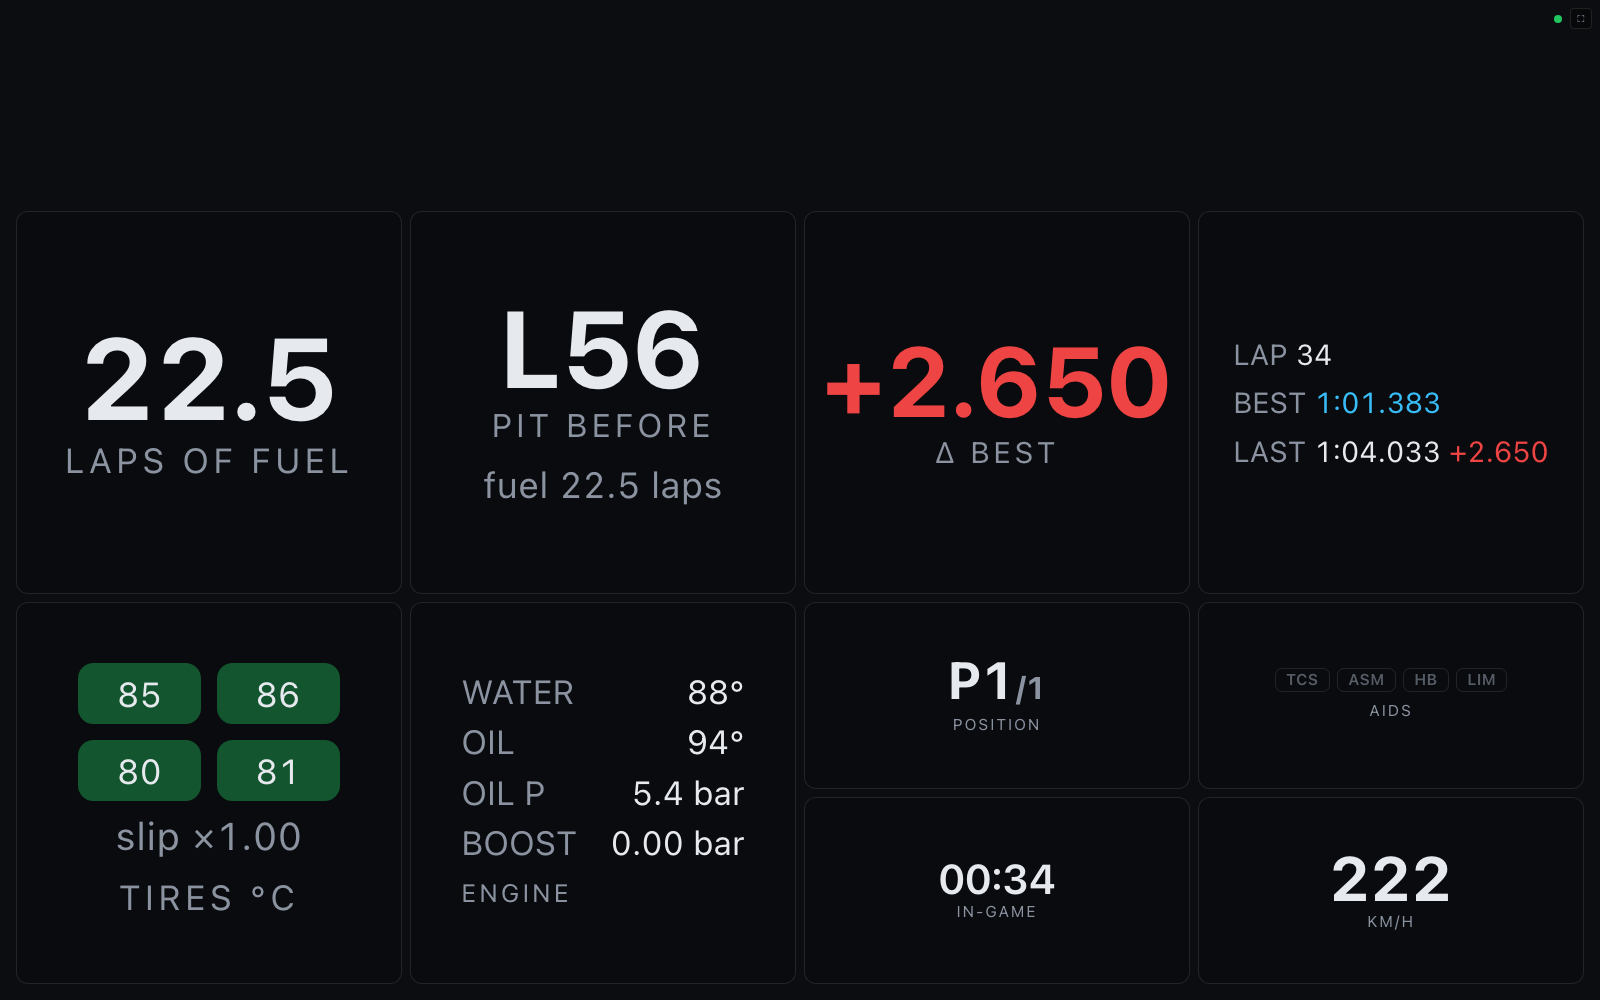
Overlay & streaming — build a custom overlay for OBS, a phone dashboard, or a pit-wall tablet: pick and scale widgets, choose layouts and canvas sizes, save named presets.
Screenshots
Live view — race readouts, driver-aid pills, strategy, and the clickable lap feed:
Sessions view — lap-time sparklines and per-lap metrics with event counts
(2L·1S·4B = lockups · wheelspins · bottoming):
OBS overlay — one of the layouts from the overlay builder, at an exact canvas size:

Driver dashboard — the Race engineer preset for a second display during the race:
All screenshots were captured against the built-in simulated telemetry source.
How it works
Curious about the internals? The How it works section explains the machinery in detail:
- Architecture — how capture, processing, storage, and the UI fit together
- Telemetry capture — the GT7 UDP protocol, Salsa20 decryption, and every decoded field
- Lap detection & sessions — how laps are cut from the stream and grouped into sessions
- Derived channels & metrics — the math behind every computed channel and per-lap aggregate
- Chassis event detection — how lockups, wheelspin, bottoming, and kerb strikes are found
- Fuel & race strategy — the live pit-window and fuel-to-empty calculations
Credits & related projects
GT7 Datalogger has full feature parity with snipem/gt7dashboard — the original Python race-telemetry dashboard — plus additional features: the analysis channel picker, Corner Detail widget, chassis event detection, track auto-identification, the overlay builder, and webhook notifications, all rebuilt on a cleaner architecture with a modern UI.
Also see MacManley/gt7-udp, a GT7 UDP telemetry parser for ESP32 / ESP8266 boards and a great reference for the packet format.
Licensed under the MIT License.